Airlines and customers are increasingly concerned about flight delays. Flight delays are a major problem in the aviation sector. The rising frequency of flight delays puts a financial burden on the airline industry. Decision Tree (DT), Logistic Regression (LR), Random Forest (RF), and K-Nearest Neighbor (KNN) machine learning algorithms are implemented using the Flight Status Prediction Dataset to deal with the problem. Classification Report and Confusion Matrix, AUC-ROC score, and curve and SHAP analysis are used to evaluate the model's performance. The study compares the performance of models to identify the most effective approach for predicting delays and cancellations.
Keywords: Predictive Modeling, Flight Delays, Flight Cancellations, Machine Learning, Decision Tree, Logistic Regression, Random Forest, K-Nearest Neighbors, Data-Driven Approach, SHAP.
I. INTRODUCTION
A. Background
The aviation sector is an essential part of international transportation for millions of people and products to travel daily. However, there are a lot of difficulties associated with flight delays and cancellations, which can result in financial loss, unhappy customers, and inefficient operations [1]. Airline operations are disrupted, expenses rise, and passengers experience inconvenience as a result of flight cancellations and delays. Airlines struggle to efficiently deploy resources, manage scheduling, and notify passengers in advance due to the lack of an accurate forecasting system [2].
B. Motivation
A 2014 analysis by the Frankfurt-based consulting firm found that airline delays cost the global economy $25 billion. There was an indirect $4 billion decline in the US gross domestic product (GDP) due to domestic aircraft delays [3]. The motivation of this study is to apply predictive modeling to improve flight operations.
C. Problem Statement
The problem in this research is flight delay and cancellation which will be addressed using machine learning (ML) algorithms, specifically classification techniques. The project implements ML models that can predict delays and cancellations by analyzing past flight data.
D. Aims/Objectives
This research is aimed at developing and evaluating ML predictive models using classification algorithms for the problem of flight delays and cancellations. The objectives are as follows:
- Exploring and investigating classification algorithms in general and specific to airline industry problems.
- Exploring important factors contributing to airline delays and cancellations, finding a suitable dataset including those features, and analyzing the data.
- Utilizing “Machine Learning classification algorithms including Decision Tree, Random Forest, Logistic Regression, and K-Nearest Neighbor” to predict the aircraft delay and cancellation on a test dataset.
- Evaluating and comparing the performance of the developed Machine Learning predictive models.
- Determine the association of predictive features with the output variable using explainable AI to understand the factors that most contribute to flight delays and cancellations.
E. Research Questions
The research questions are:
- How will classification algorithms perform in predicting aircraft delays and cancellations?
- Which model provides the best accuracy in predicting aircraft delays and cancellations?
- Which factors are important to predict delays and cancellations?
F. Contribution
The multi-class classification provides an advanced perspective of flight performance. The creative development of a new target variable, 'flight_status' is a significant advancement. The combination of correlation analysis and the ANOVA F-test for feature selection demonstrates an advanced strategy. The proposed solution employs extensive ML techniques and evaluation metrics.
II. LITERATURE REVIEW
III. DATA ANALYSIS
The Flight Status Prediction Dataset (2018-2022) has been used [23]. The dataset was downloaded from the Kaggle website. The original dataset is massive. A data sample comprising data from 5 years has been created. Unnecessary attributes have been eliminated. “combined_flight_sample2018-2022.csv” has 10% data for all years and 38 features. It has 2919378 entries. Missing values are addressed using the median and mode. Outliers were handled using the IQR method.
The “cancelled” variable was label encoded. Combining correlation analysis and the ANOVA F-test for feature selection effectively identifies significant features. A key innovation was consolidating cancellation and delay data into a new flight_status target variable. One-hot encoding of the target variable ensures compatibility with ML models.
IV. METHOD
K-Nearest Neighbors, Decision Trees, Random Forest, and Logistic Regression algorithms are chosen to develop prediction models, ensuring a comprehensive approach. An 80/20 ratio for training and testing splits the dataset, while SMOTE mitigates class imbalances to prevent bias towards the majority class.
A. Random Forest
Random Forest uses a collection of decision trees to achieve accurate predictions. The technique combines bagging techniques with feature unpredictability methods. The built-in feature significance ratings of RF aid in the identification of crucial predictive variables. RF prevents overfitting and noise effectively. RF analyzes features according to their impact on future predictions [24].
Important parameters have been fine-tuned in the Random Forest model to balance complexity and generalization. The number of Trees (n_estimators) = 100 has been used to keep the model light and avoid excessive processing. Tree Depth (max_depth) = 10 has been used to prevent deep trees from overfitting. random_state = 42 has been used.
B. Decision Tree
Decision Trees are adaptive models that divide data into subgroups based on feature values. They can encode complex decision-making rules and feature interactions. Decision trees create straightforward "if-then" rules [25]. The DT algorithm creates a training model that employs decision rules derived from training data to predict a value or class of target variables. DT categorizes situations by constructing a tree from the root to a few leaf nodes [26].
Important parameters have been fine-tuned to balance performance and avoid overfitting. Gini criteria have been used to split nodes in the decision tree. It is computationally faster because it does not require logarithms. Max Depth = 10 has been used to prevent overfitting. It limits tree depth to avoid excessively complex splits. random_state=42 has been used.
C. Logistic Regression
Logistic regression forecasts the possibility of an outcome using predictor factors. The simplicity and interpretability make it an excellent choice for determining the impact of characteristics on predictions. LR generates explicit coefficients that measure the impact of features [27]. A response consists of two possible answers: yes/no. LR model relates probabilities to predictor variables [28].
Key parameters have been fine-tuned to regulate regularization and convergence. Regularization Strength (C) = 10 has been used. It controls regularization strength and prevents overfitting. The (max_iter) have been set to 500 for better convergence speed. Solver = "lbfgs" has been used. Model implemented L2 penalty regularization to reduce model variance. random_state=42 has been used.
D. K-Nearest Neighbors
KNN operates as a non-parametric classifier that identifies points through their closest neighbors where the majority class prevails. KNN ability to extract local trends effectively and maintain a simple implementation [29]. KNN algorithm classifies data according to its closest k neighbors after estimating the distance between a new sample and the available data. KNN algorithm calculates the distance between samples. A simple majority vote among each point's k closest neighbors determines its classification [28].
Key hyperparameters have been fine-tuned to optimize the KNN model. The number of neighbors (n_neighbors) = 10 has been used for classification. Weight Function (weights) = "uniform" has been utilized. It means the same weight will be used for all neighbors. Distance Metric (metric) = Euclidean distance was chosen for the model.
V. EVALUATION
The evaluation techniques are comprehensive. The classification report assessed the overall performance of the models. Confusion matrix identified model error areas. AUC-ROC score and curve indicate the way each model distinguishes classes. Incorporating Explainable AI is a significant innovation. SHAP beeswarm plots show feature impacts on forecasts, enhancing transparency. The model with the best accuracy in predicting aircraft delays and cancellations will be identified.
A. Classification Report
The classification report gives a detailed assessment of the model's performance. It includes accuracy, precision, recall, and F1-score. This report assists in comparing performance across classes [30]. Figure 1 shows LR has 97% Accuracy, 0.95 Precision, 0.97 Recall, and 0.96 F1-score. Other models performed better than LR.
Random Forest has 100% Accuracy, 1.00 Precision, 1.00 Recall, and 1.00 F1-score. The RF model received perfect scores on this dataset.
The Decision Tree has 100% Accuracy, 1.00 Precision, 1.00 Recall, and 1.00 F1 Score. The DT model performs well but less than RF. K-Nearest Neighbors has a 99% Accuracy, 0.99 Precision, 0.99 Recall, and 0.99 F1-score. RF gives a better overall performance.
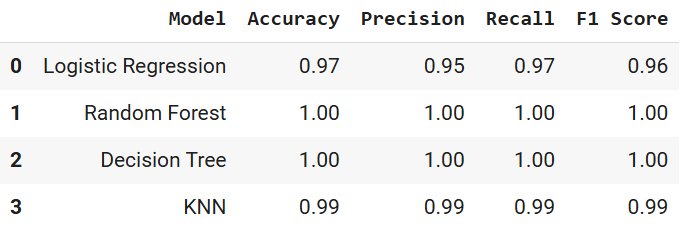 Fig. 1. Model Results
B. AUC-ROC
Fig. 1. Model Results
B. AUC-ROC
AUC-ROC statistics assess the ability of models to differentiate across classes. The results show that RF has 0.9998, DT has 0.9996, LR has 0.9294, and KNN has 0.9990 AUC-ROC Score. RF outperformed all models.
TABLE I. AUC-ROC SCORE COMPARISON
| Model | AUC-ROC Score |
|---|
| Random Forest | 0.9998 |
| Decision Tree | 0.9996 |
| Logistic Regression | 0.9294 |
| K-Nearest Neighbor | 0.9990 |
C. Confusion Matrix
The confusion matrix gives a detailed breakdown of the performance of models by displaying the counts of TP, FP, TN, and FN. It aids in understanding faults that the model makes [31].
The confusion matrix of RF model shows 15,508 flights were accurately projected as cancelled. 156 cancelled flights were incorrectly labeled as on-time. 96,615 flights were accurately predicted as delayed. 471,578 flights were accurately projected as on-time. 19 on-time planes were wrongly predicted as cancelled. The model worked well with a few misclassifications.
The DT model shows that 15,581 cancelled flights were classified perfectly, but 83 cancelled flights were wrongly predicted as on time. Similarly, 82 flights were wrongly predicted as cancelled. 96,615 are correctly predicted as delayed, and 471,515 are correctly predicted as on time. 82 predictions are wrong as cancelled.
The LR model incorrectly predicted 15,664 cancelled flights as on-time. This indicates that it cannot forecast any cancellations. The model accurately predicted 96,615 predictions as delayed. The model performs well on on-time flights with 471,353 correct predictions. But there are 242 that are misclassified as cancelled and 2 as delayed.
The KNN model accurately predicted 15,558 cancelled flights and misclassified 106 as on-time. The model classified 96,556 delayed flights accurately and misclassified 59 as on-time. 468,348 predictions were correctly classified for on-time flights with 97 misclassified predictions as cancelled and 3,152 as delayed. Overall, the model has minimal mistakes.
D. SHAP
SHAP is an explainable AI technique to evaluate model performance, feature relevance, and decision-making behavior. SHAP assigns feature priority based on cooperative game theory. SHAP identifies which aspects cause cancellations, delays, and on-time predictions.
SHAP analysis shows that RF has well-balanced SHAP values. It assigns feature importance evenly and results in balanced predictions. DT improves feature distribution but lacks strong separation for delayed flights. LR demonstrated an overreliance on delay-related properties, making it susceptible to errors in unseen data. KNN does not provide a clear feature influence, making it less interpretable. According to SHAP analysis, RF is the greatest option for predicting flight status because it is stable, accurate, and easy to comprehend.
VI. CONCLUSION
This study examined ML methods for predicting aircraft cancellations and delays. Forecasting airline delays with ML techniques shows significant potential. The proposed solution is a structured strategy, applying extensive models and evaluation metrics. SHAP was used for feature importance mapping. Findings indicate all strategies were effective, with the RF model outperforming other classifiers. Data-driven strategies enhance operational effectiveness and decision-making in aviation. This project provides a foundation for future advancements in flight prediction analytics. Future research can enhance contributions by incorporating new data sources and algorithms.
REFERENCES
[1] R. K. Jha, S. B. Jha, V. Pandey, and R. F. Babiceanu, "Flight Delay Prediction using Hybrid Machine Learning Approach: A Case Study of Major Airlines in the United States," arXiv preprint, arXiv:2409.00607, 2024.
[2] I. Hatıpoğlu and Ö. Tosun, "Predictive Modeling of Flight Delays at an Airport Using Machine Learning Methods," Applied Sciences, vol. 14, no. 13, p. 5472, 2024.
[3] A. M. Kalliguddi and A. K. Leboulluec, "Predictive modeling of aircraft flight delay," Universal Journal of Management, vol. 5, no. 10, pp. 485-491, 2017.
[4] J. M. Anguita and O. D. Olariaga, "Prediction of departure flight delays through the use of predictive tools based on machine learning/deep learning algorithms," The Aeronautical Journal, vol. 128, no. 1319, pp. 111-133, 2024.
[5] P. Hu, J. Zhang, and N. Li, "Research on Flight Delay Prediction Based on Random Forest," in 2021 IEEE 3rd International Conference on Civil Aviation Safety and Information Technology (ICCASIT), pp. 506-509, Oct. 2021. IEEE.
[6] C. A. I. Kaiquan, L. I. Yue, Z. H. U. Yongwen, F. A. N. G. Quan, Y. A. N. G. Yang, and D. U. Wenbo, "A geographical and operational deep graph convolutional approach for flight delay prediction," Chinese Journal of Aeronautics, vol. 36, no. 3, pp. 357-367, 2023.
[7] Q. Li and R. Jing, "Flight delay prediction from spatial and temporal perspective," Expert Systems with Applications, vol. 205, p. 117662, 2022.
[8] M. Alfarhood, R. Alotaibi, B. Abdulrahim, A. Einieh, M. Almousa, and A. Alkhanifer, "Predicting Flight Delays with Machine Learning: A Case Study from Saudi Arabian Airlines," International Journal of Aerospace Engineering, vol. 2024, no. 1, p. 3385463, 2024.
[9] R. T. Reddy, P. B. Pati, K. Deepa, and S. T. Sangeetha, "Flight Delay Prediction Using Machine Learning," in 2023 IEEE 8th International Conference for Convergence in Technology (I2CT), pp. 1-5, Apr. 2023. IEEE.
[10] C. Y. Yiu, K. K. Ng, K. C. Kwok, W. T. Lee, and H. T. Mo, "Flight delay predictions and the study of its causal factors using machine learning algorithms," in 2021 IEEE 3rd International Conference on Civil Aviation Safety and Information Technology (ICCASIT), pp. 179-183, Oct. 2021. IEEE.
[11] Y. Tang, "Airline flight delay prediction using machine learning models," in Proceedings of the 2021 5th International Conference on E-Business and Internet, pp. 151-154, Oct. 2021.
[12] I. Hatıpoğlu and Ö. Tosun, "Predictive Modeling of Flight Delays at an Airport Using Machine Learning Methods," Applied Sciences, vol. 14, no. 13, p. 5472, 2024.
[13] K. Kiliç and J. M. Sallan, "Study of delay prediction in the US airport network," Aerospace, vol. 10, no. 4, p. 342, 2023.
[14] Z. Wang, C. Liao, X. Hang, L. Li, D. Delahaye, and M. Hansen, "Distribution prediction of strategic flight delays via machine learning methods," Sustainability, vol. 14, no. 22, p. 15180, 2022.
[15] E. Esmaeilzadeh and S. Mokhtarimousavi, "Machine learning approach for flight departure delay prediction and analysis," Transportation Research Record, vol. 2674, no. 8, pp. 145-159, 2020.
[16] P. Meel, M. Singhal, M. Tanwar, and N. Saini, "Predicting flight delays with error calculation using machine learned classifiers," in 2020 7th International Conference on Signal Processing and Integrated Networks (SPIN), pp. 71-76, Feb. 2020. IEEE.
[17] B. Sridhar, "Applications of machine learning techniques to aviation operations: Promises and challenges," in 2020 International Conference on Artificial Intelligence and Data Analytics for Air Transportation (AIDA-AT), pp. 1-12, Feb. 2020. IEEE.
[18] G. Gui, F. Liu, J. Sun, J. Yang, Z. Zhou, and D. Zhao, "Flight delay prediction based on aviation big data and machine learning," IEEE Transactions on Vehicular Technology, vol. 69, no. 1, pp. 140-150, 2019.
[19] B. Alharbi and M. Prince, "A hybrid artificial intelligence approach to predict flight delay," International Journal of Engineering Research and Technology, vol. 13, no. 4, pp. 814-822, 2020.
[20] W. A. Khan, S. H. Chung, A. E. Eltoukhy, and F. Khurshid, "A novel parallel series data-driven model for IATA-coded flight delays prediction and features analysis," Journal of Air Transport Management, vol. 114, p. 102488, 2024.
[21] X. Wang, Z. Wang, L. Wan, and Y. Tian, "Prediction of flight delays at Beijing capital international airport based on ensemble methods," Applied Sciences, vol. 12, no. 20, p. 10621, 2022.
[22] W. Shao, A. Prabowo, S. Zhao, S. Tan, P. Koniusz, J. Chan, and F. D. Salim, "Flight delay prediction using airport situational awareness map," in Proceedings of the 27th ACM SIGSPATIAL International Conference on Advances in Geographic Information Systems, pp. 432-435, Nov. 2019.
[23] R. Mulla, "Flight status prediction," Kaggle, 2022. [Online]. Available: https://www.kaggle.com/datasets/robikscube/flight-delay-dataset-20182022.
[24] A. Gole, S. Singh, P. Kanherkar, P. R. Abhishek, and P. Wankhede, "Comparative Analysis of Machine Learning Algorithms: Random Forest algorithm, Naive Bayes Classifier and KNN-A survey," in International Journal for Research Publication and Seminar, vol. 13, no. 3, pp. 194-197, Apr. 2022.
[25] A. V. Joshi, Decision Trees, in Machine Learning and Artificial Intelligence, pp. 73-87, Cham: Springer International Publishing, 2022.
[26] H. Blockeel, L. Devos, B. Frénay, G. Nanfack, and S. Nijssen, "Decision trees: from efficient prediction to responsible AI," Frontiers in Artificial Intelligence, vol. 6, p. 1124553, 2023.
[27] A. Das, Logistic Regression. In Encyclopedia of Quality of Life and Well-Being Research, Cham: Springer International Publishing, 2024, pp. 3985-3986.
[28] I. H. Sarker, "Machine learning: Algorithms, real-world applications and research directions," SN Computer Science, vol. 2, no. 3, p. 160, 2021.
[29] P. Cunningham and S. J. Delany, "K-nearest neighbour classifiers-a tutorial," ACM Computing Surveys (CSUR), vol. 54, no. 6, pp. 1-25, 2021.
[30] O. Rainio, J. Teuho, and R. Klén, "Evaluation metrics and statistical tests for machine learning," Scientific Reports, vol. 14, no. 1, p. 6086, 2024.
[31] B. J. Erickson and F. Kitamura, "Magician’s corner: 9. Performance metrics for machine learning models," Radiology: Artificial Intelligence, vol. 3, no. 3, p. e200126, 2021.